MICHAEL NATALIZIO
Business Analytics Advisor at HNI
Data can be a gamechanger in the trucking industry. Our systems gather all kinds of information – speed, idle time, fuel efficiency, claims and losses, citations, and more.
The challenge for most companies we work with is not a lack of information, but rather a complicated overabundance that can paralyze even the best-intentioned efforts to extract meaningful insights.
For both P&C and employee benefits, we recommend that companies put on their “data scientist” hats when designing their programs.
Choose the key metrics that will drive the success of your program, and then dig deep to analyze what behaviors drive those numbers. Visualize those KPIs with a leading analytics tool, and you'll be able to track the impact of your efforts in real time.
A Data-Driven Look at Safety
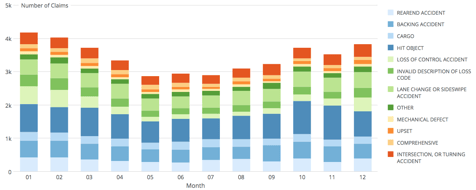
Great West, one of our insurance partners, took an analytical view of what patterns their transportation customers were seeing industry-wide. They analyzed what types of losses were most common and when they are most likely to occur.
Great West shared this information (and authorized us to share it with our blog readership) with the goal of raising awareness and helping customers improve by deploying focused safety training delivered at the right moment.
12 Months of Safety: What’s Hot When
The following trends emerged as Great West looked at its customers’ loss history:
June
Spike in Mechanical Defect losses. Lane Change/Sideswipe, Rear-End, and Hitting Object losses continue to occur.
July
High frequency of Intersections/Run Unders and Backing.
August
Spike in Sideswipe and Rear-End Collisions.
September
Spike in Intersections/Run Under collisions.
October
Three prevalent areas: Rear-End Collisions, Lane Change/Sideswipe and Backing.
November
Upward trend in Loss of Control and Hitting Object crashes.
December
Spike in Loss of Control/Upset and Intersections/Run-Under collisions.
January
Increase in Loss of Control claims. Road/weather conditions and improper speed were often contributors to Loss of Control crashes.
February
Spike in Upset/Loss of Control crashes. Although weather plays a significant role in loss of control crashes, Upset crashes are usually the result of speed too fast for conditions or dropping a wheel off the roadway.
March
A spike in three crash types: Rear-End, Intersections and Hitting Objects.
April
Two significant collision types: Rear-Ends and Lane Change/Side Swipe crashes.
May
Rear-End and Lane Change/Sideswipe collisions continue to trend upward. In addition, Hitting Objects claims begin to increase.
Putting this Information to Work For You
So how do you take advantage of this information?
Let's start by examining your company's experience. Does your history mirror what Great West sees for all of its customers? (Need help analyzing this? Just reach out to your relationship manager or comment below, and we'll show you.)
How do your losses in the current year compare to the same time last year? Is your average cost per claim trending up or down? How about the frequency or severity of your losses when adjusted for mileage growth?
When you understand all of the intricacies of your business, you can target the areas with the highest potential ROI.
And it just so happens that we have crafted training resources that our customers can deploy each week, according to the “themes of the month” above. Or even better, we can help you do this analysis on your own claims history and design a targeted safety improvement program.
We’re only scratching the surface of the ways “big data” can change our businesses. There’s an amazing opportunity to be creative about how to leverage information to improve business results, and we’re excited by the opportunity to help our customers do so.
Related Content
Top 10 Worker's Compensation Claim Handling Mistakes
It's Your Turn to Program HNI U
Technology & The Rise of the Fauxmergency
ON-DEMAND WEBINAR: Doing More With Less: Developing a Self-Service Culture Using HR Technology
Freight Claims: 5 Liability Exceptions Under the Carmack Amendment
.png?width=69&height=53&name=Acrisure%20Logo%20(White%20Horizontal).png)


